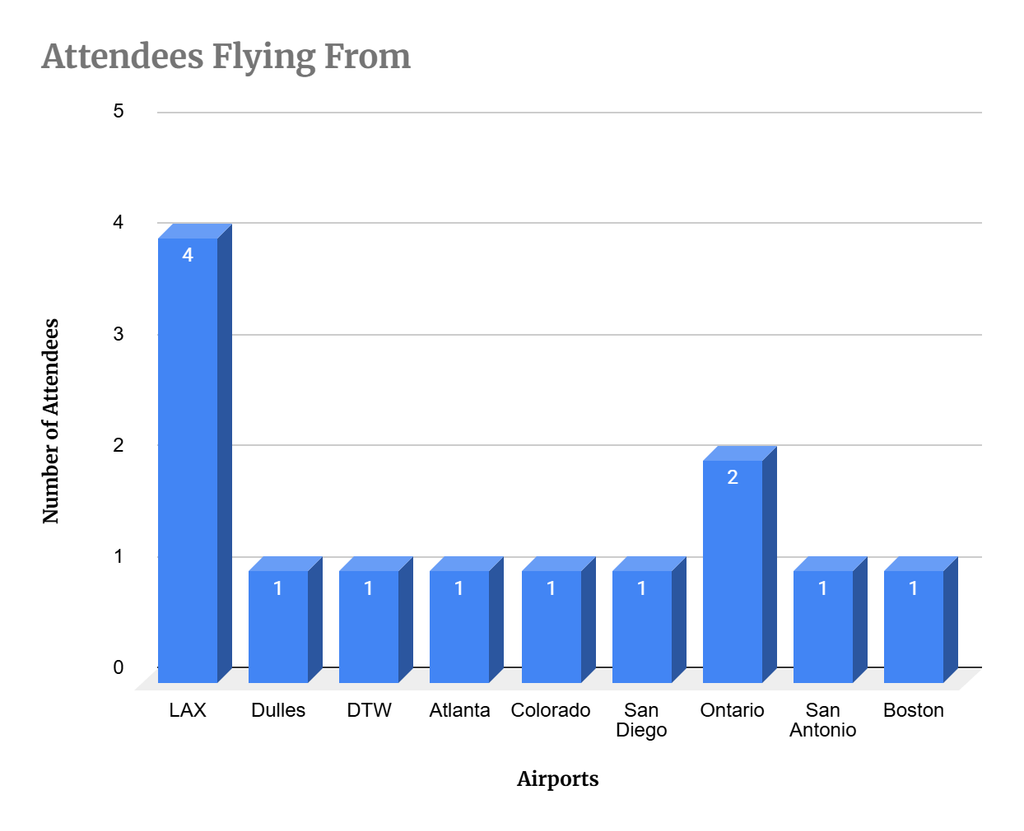
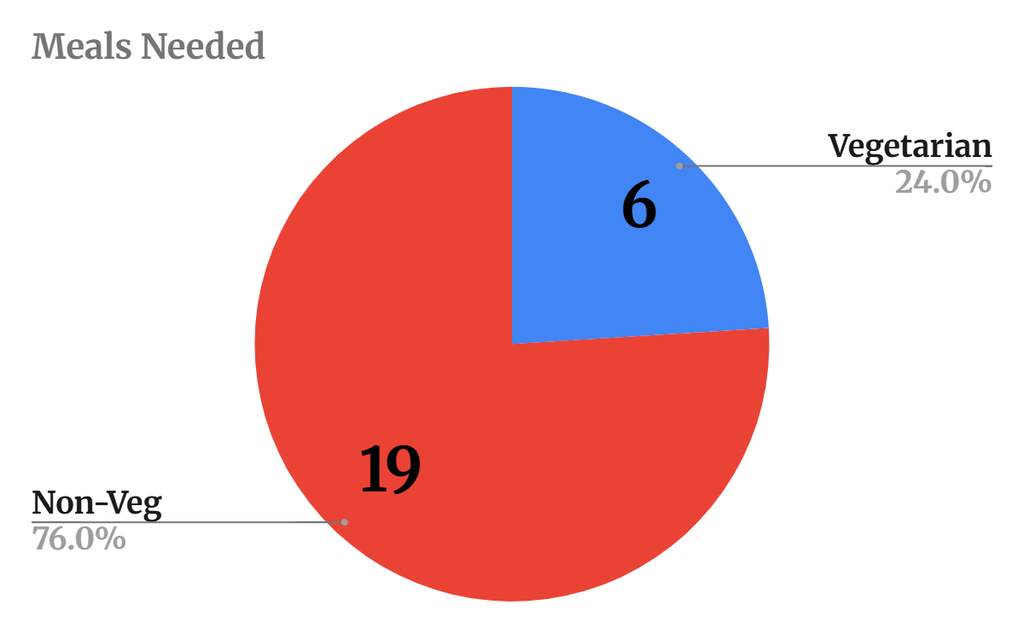
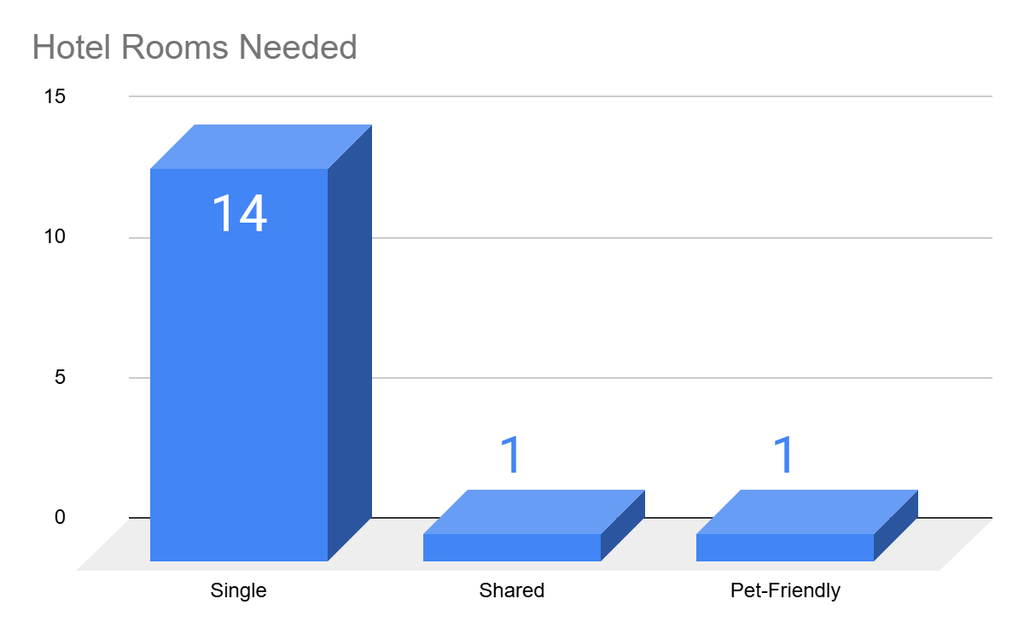
Today I finished up the Event Project. It was fun to take the raw data and use formulas and charts to create quantified data on other sheets. Like using the =filter and =choosecols formulas to create a new spreadsheet with just attendee’s names, their airport, and preferred flight time. And if there’s any changes done to the raw data the formula allows the filtered data to dynamically adjust to match.
And then using the graphs I created in the email was nice because I’m sure a supervisor would appreciate getting visualized data instead of just everything conveyed through text.